


Market Week Ahead: US Data, Nasdaq 100, US Dollar and Gold
- A handful of high-importance US data releases may stoke volatility next week.
- Are the Nasdaq and S&P 500 in the process of topping out?
- Gold and the US dollar push higher.
For all market-moving economic data and events, see the DailyFX Calendar
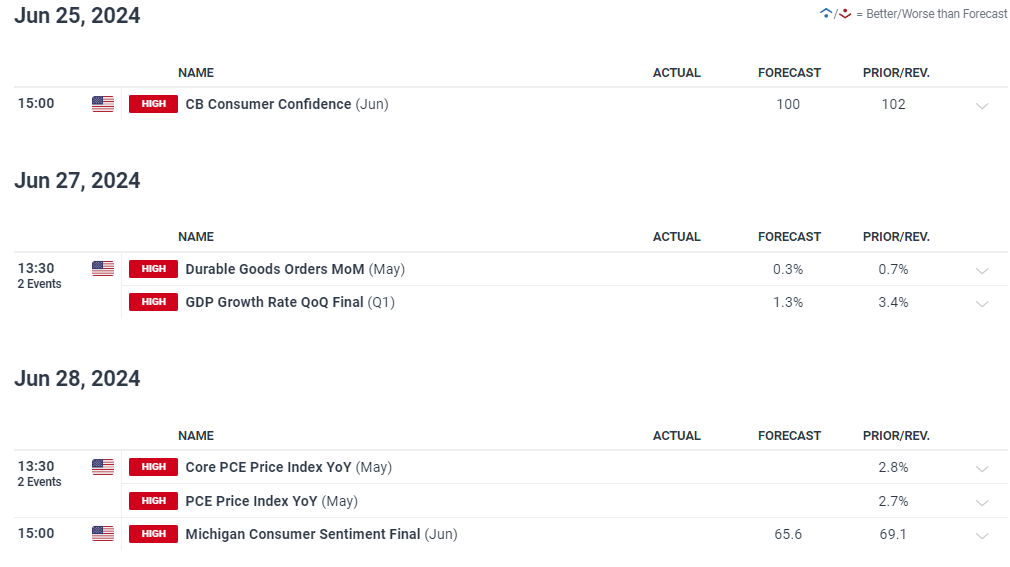
Financial markets may see renewed volatility next week on the back of some notable US economic data releases. While CB consumer confidence, durable goods, and Michigan consumer confidence are potential market movers, Wednesday’s final US Q1 GDP report and Friday’s US core PCE release are next week’s heavy hitters. The latter has recently stalled around 2.8%, well above the Fed’s 2% target, and another unchanged print will increase pressure on the Federal Reserve to leave rates untouched for longer.

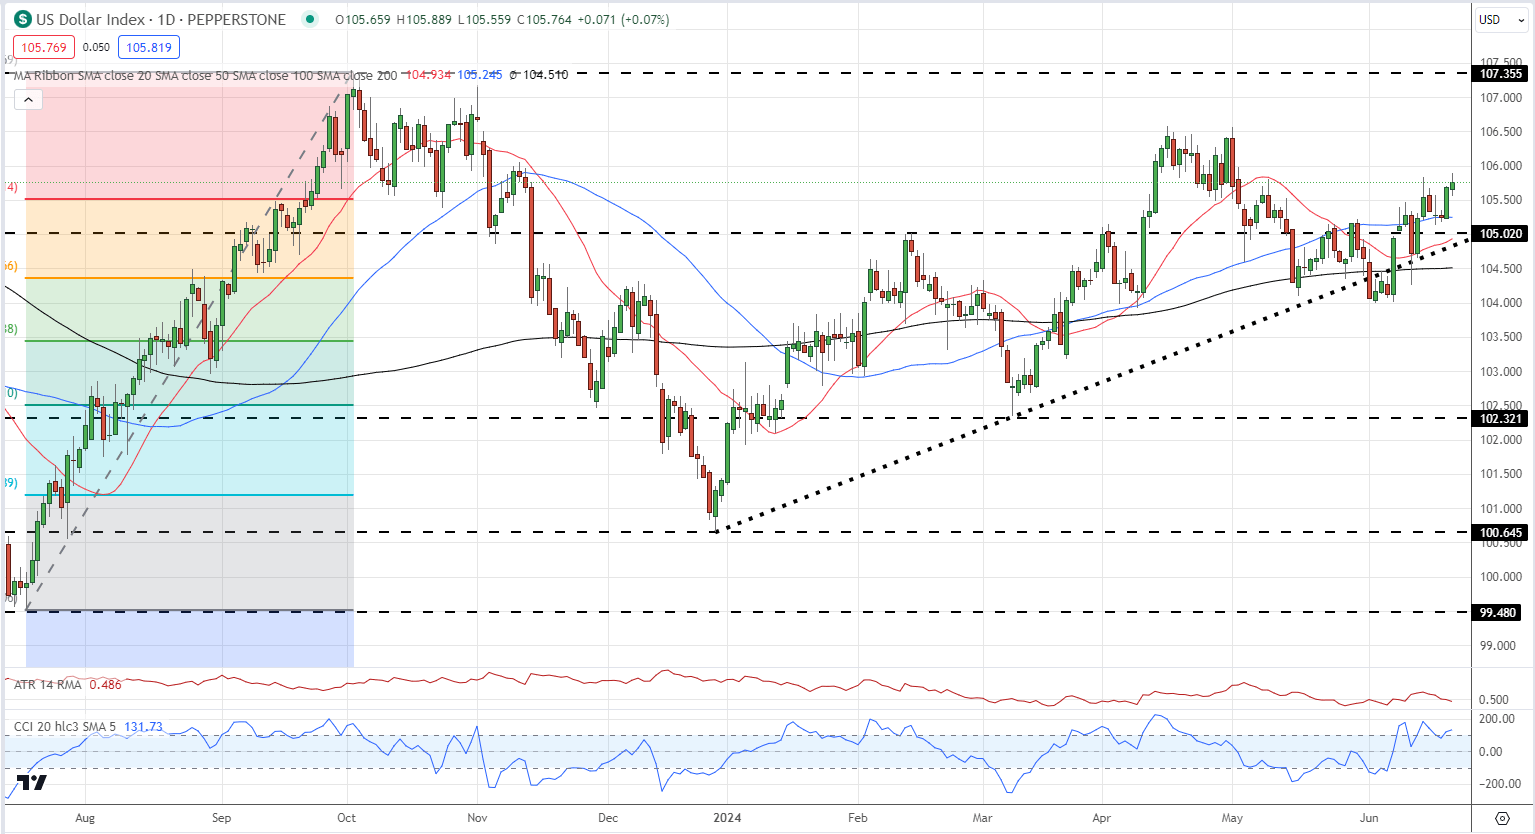
The US dollar continues to move higher with the DXY boosted by weakness in the Euro, British Pound, and Japanese Yen. This year’s series of higher lows and higher highs remains in place and the index is closing in the recent double high around 106.60. To break above this multi-month high, the US dollar is going to have to make the running and not rely on weakness in other G7 currencies.
British Pound (GBP) Latest – Sterling Continues to Slide After Dovish BoE Turn
Japanese CPI Data Mixed as Yen Continues Steady Decline
US Dollar Index Daily Chart
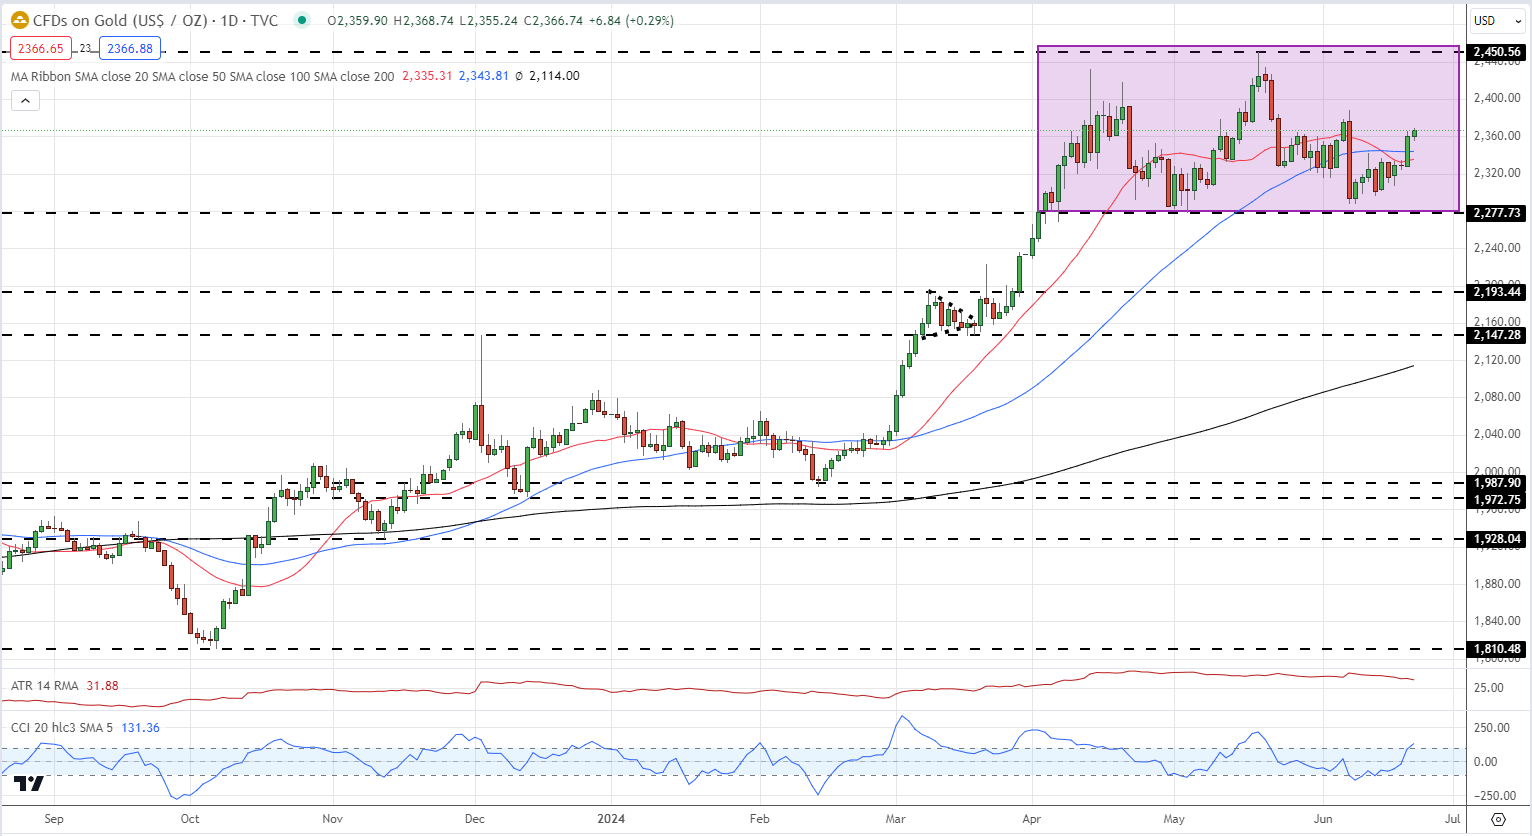
Gold remains in a multi-week sideways range, pushing back towards resistance despite a stronger US dollar. The precious metal is back above all three simple moving averages and looks set to test $2,400/oz. next week.
Gold Respecting a Recent Trading Range but Support Needs to Hold Firm
Gold Daily Price Chart

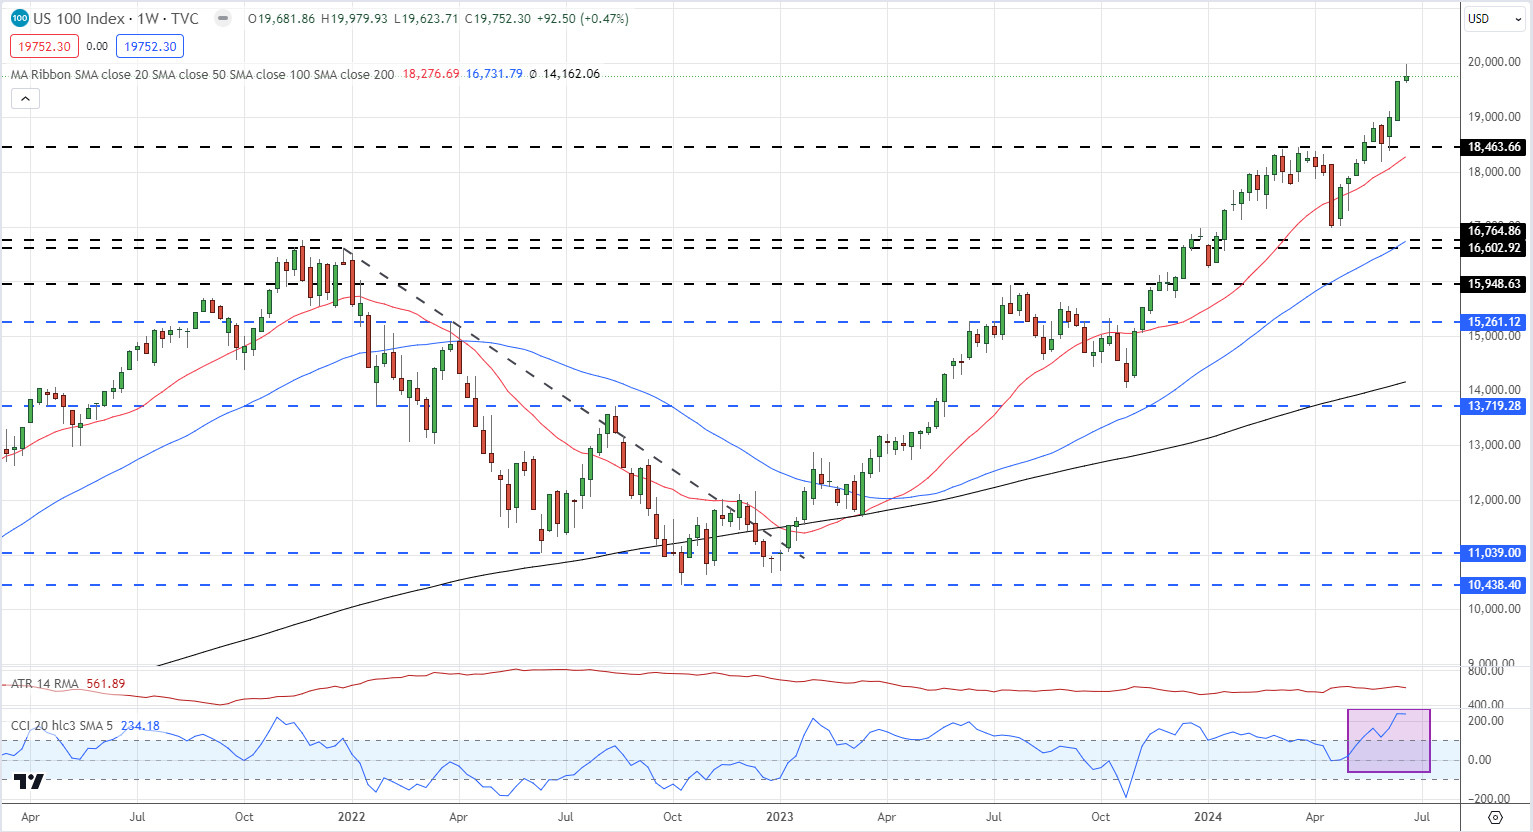
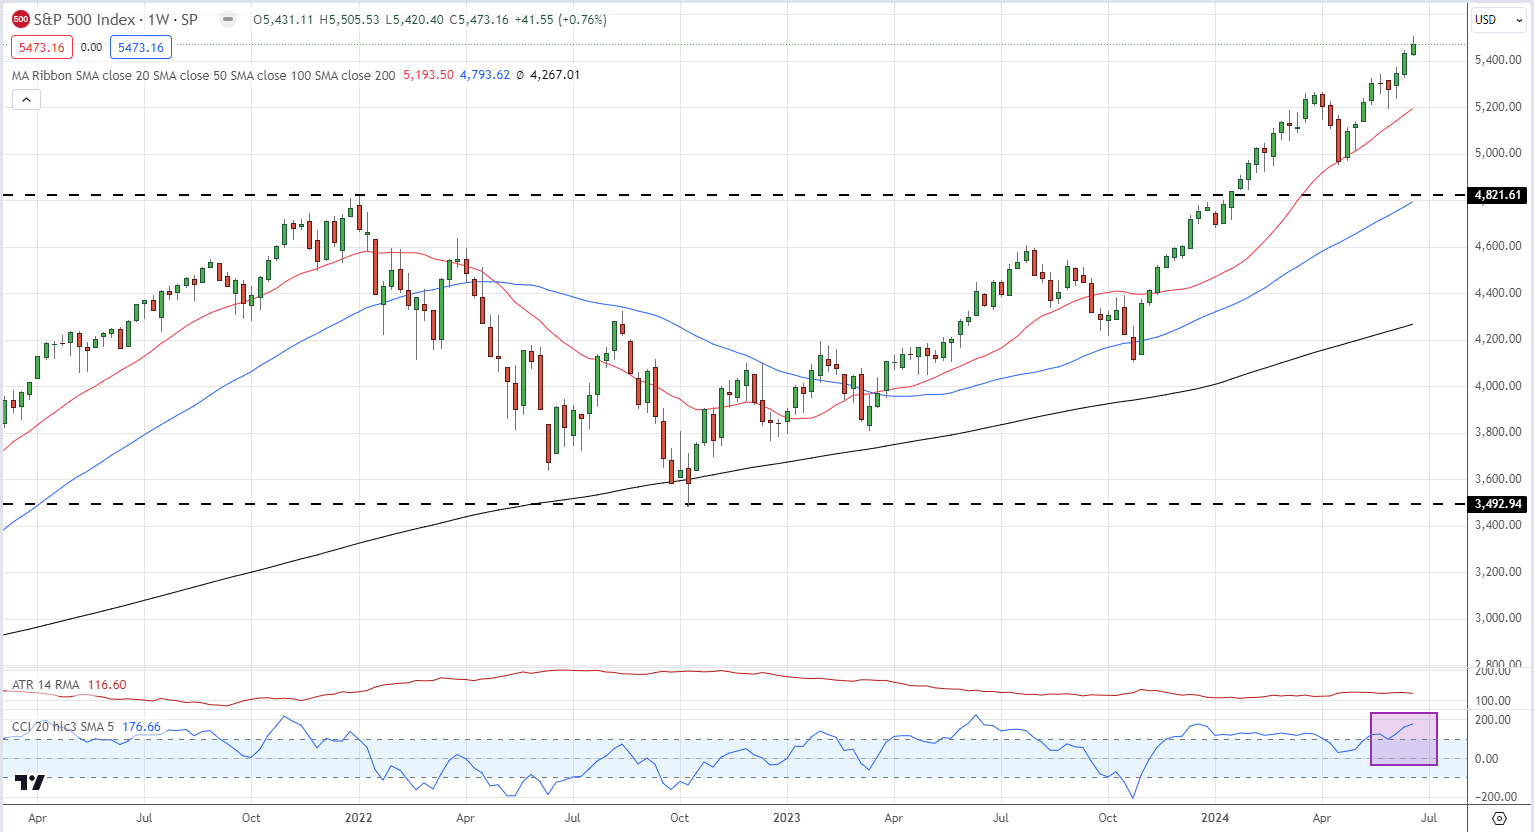
The Nasdaq 100 and S&P 500 have been posting fresh highs on a regular basis, powered by tech giants including Nvidia, Apple, and Microsoft. These three companies alone account for roughly 26% of the Nasdaq’s market capitalization and 21% of the S&P 500. Market concentration is not new but buyers should be aware of the risk involved when indices are driven by a very small number of stocks. The Nasdaq 100 and the S&P500 both look heavily overbought (CCI indicator) as the market starts to prepare for the next US earnings season.
Nasdaq 100 Daily Chart
S&P 500 Daily Chart
| Change in | Longs | Shorts | OI |
| Daily | -2% | 3% | 1% |
| Weekly | -1% | 0% | 0% |
All Charts using TradingView


