
NZD/USD

NZD/USD
Bullish
 52m
52m
Last updated:
Jul 3, 2024
| Low | |
| High |
of clients are net long.
of clients are net short.
Average True Range
Total Intraday Range (% of ATR)
Note: Low and High figures are for the trading day.
The NZD/USD pair shows the value of the New Zealand Dollar against the US Dollar; telling traders how many USD are needed to buy a NZD. The US Dollar is the most traded currency in the world while the NZD is consistently listed in the top ten, according to the Bank of International Settlements (2016). Get live updates on the NZD/USD rate with the chart and boost your fundamental and technical analysis with our expert NZD/USD forecast, news and analysis.
Advertisement
News & Analysis
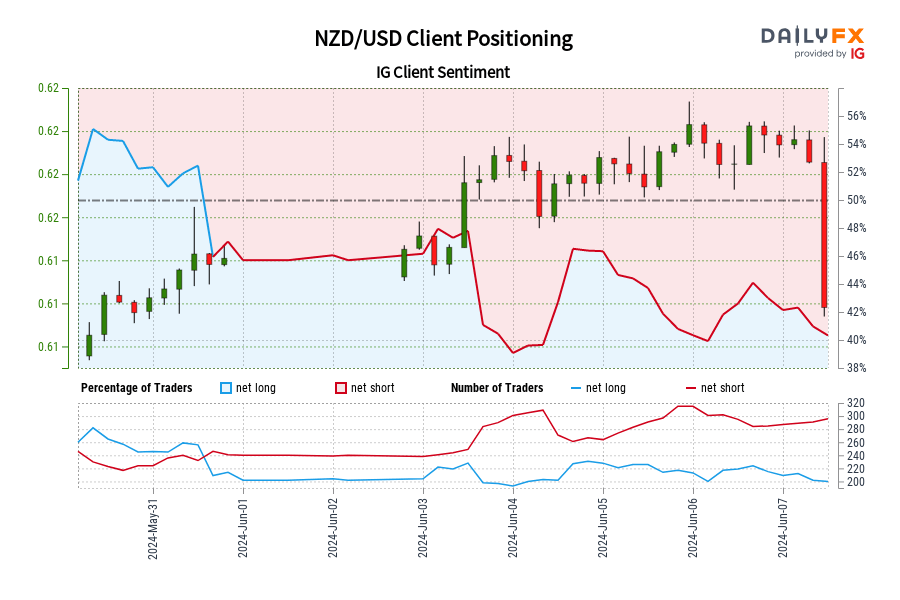
NZD/USD IG Client Sentiment: Our data shows traders are now net-long NZD/USD for the first time since May 31, 2024 14:00 GMT when NZD/USD traded near 0.61.
2024-06-07 15:23:33

US Dollar Technical Outlook: EUR/USD, GBP/USD, NZD/USD Price Setups
2024-05-23 08:30:35

US Dollar Sentiment Analysis & Outlook: GBP/USD, EUR/USD, NZD/USD
2024-05-16 00:30:00
US Dollar Sentiment Analysis & Outlook: USD/JPY, NZD/USD, USD/CAD
2024-05-07 17:00:00
Market Outlook & Sentiment Analysis: Silver, NZD/USD, EUR/CHF
2024-04-16 17:30:00
Kiwi and Aussie Outlook Ahead of the RBNZ Meeting
2024-04-08 14:12:55
Market Sentiment: Gold’s Bullish Outlook Intact; AUD/USD, NZD/USD Biased Lower
2024-04-01 17:30:00
Real Time News

Jul 3, 2024
Follow
🇬🇧 S&P Global Services PMI Final (Jun)
Actual: 52.1
Expected: 51.2
Previous: 52.9
https://t.co/pIDJYVEhgo
Jul 3, 2024
Follow
Heads Up:🇬🇧 S&P Global Services PMI Final (Jun) due at 08:30 GMT (15min)
Expected: 51.2
Previous: 52.9
https://t.co/pIDJYVEhgo
Jul 3, 2024
Follow
💶 HCOB Services PMI Final (Jun)
Actual: 52.8
Expected: 52.6
Previous: 53.2
https://t.co/pIDJYVEhgo


IG Client Sentiment
NZD/USD
Bullish
Daily change in
Longs
-10%
Shorts
-1%
OI
-6%
Weekly change in
Longs
-7%
Shorts
4%
OI
-3%
Advertisement
Advertisement