Japanese Yen (AUD/JPY, USD/JPY) Analysis
- The Japanese Yen continues to decline but in a less volatile manner than before
- Aussie dollar takes full advantage of the yen’s slide, USD/JPY Climbs higher
- Japanese bond yields don’t provide any favours for the yen
- Japanese inflation up next in the early hours of Friday morning

The Japanese Yen has slowly declined and is now nearing levels that prevailed moments before Japanese officials intervened in the FX market to strengthen the yen back in April. The chart below is an equal-weighted yen index showing the consistent decline in the $62 billion intervention effort.
Japanese Yen Index (equal weighting of AUD/JPY, USD/JPY, GBP/JPY and EUR/JPY)
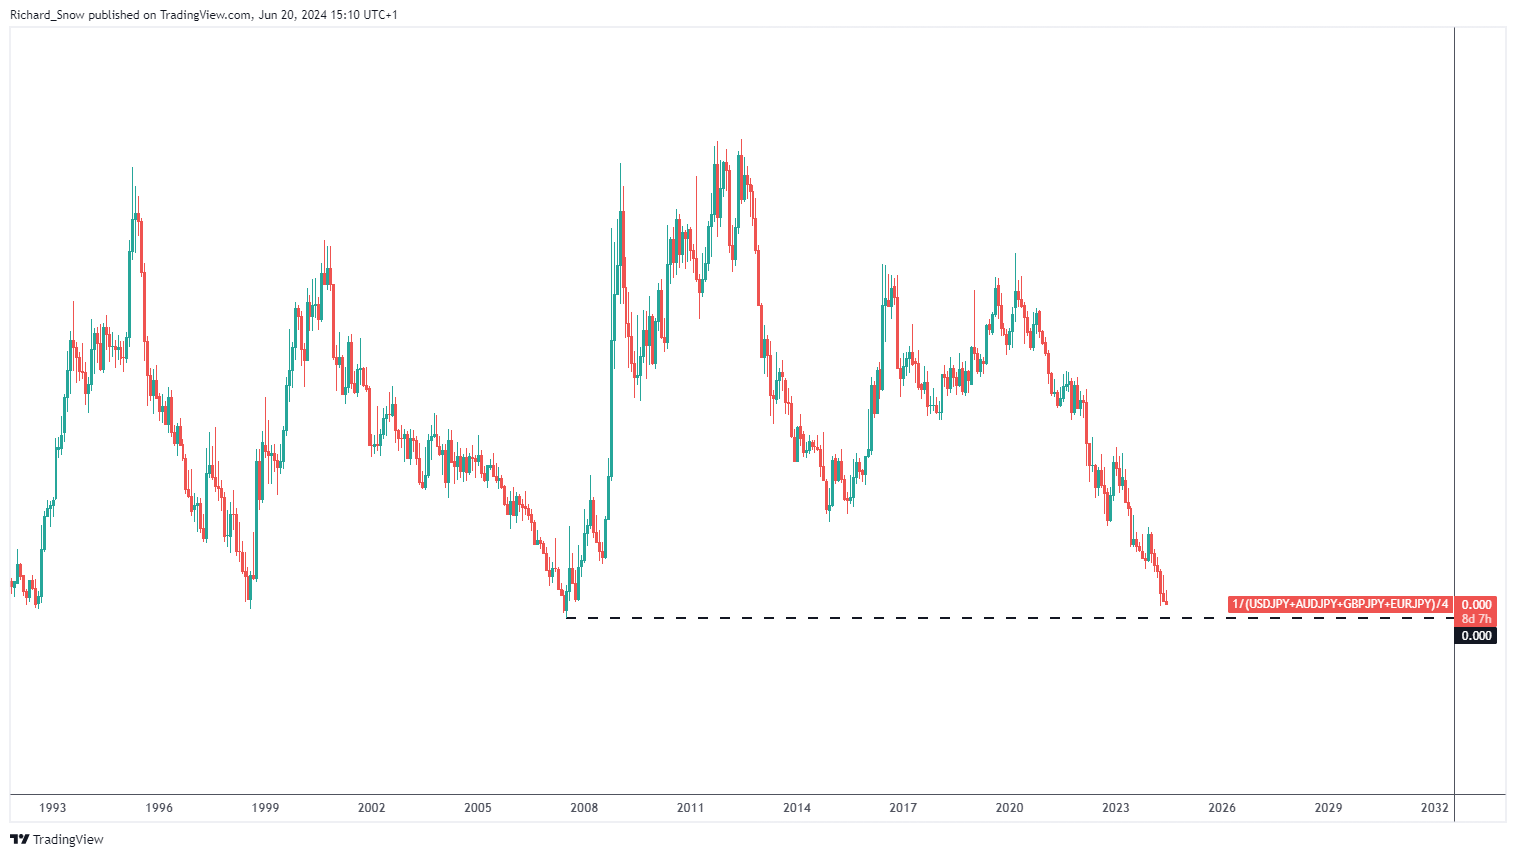
Source: TradingView, prepared by Richard Snow
Aussie Dollar Takes Advantage of the Yen’s Slide
The Aussie dollar has appreciated after the RBA mentioned they discussed the possibility of further rate hikes when the members convened earlier in June. Stubborn inflation in Australia and no real expectation of a rate cut this year are keeping the currency buoyed.
AUD/JPY has cleared 105.40 and eclipsed the pre intervention high of 104.95. With the Bank of Japan (BoJ) not expected to hike until September potentially, the yen is likely to continue to weaken against the stronger Aussie.
AUD/JPY Weekly Chart as the Pair Clears Prior Resistance
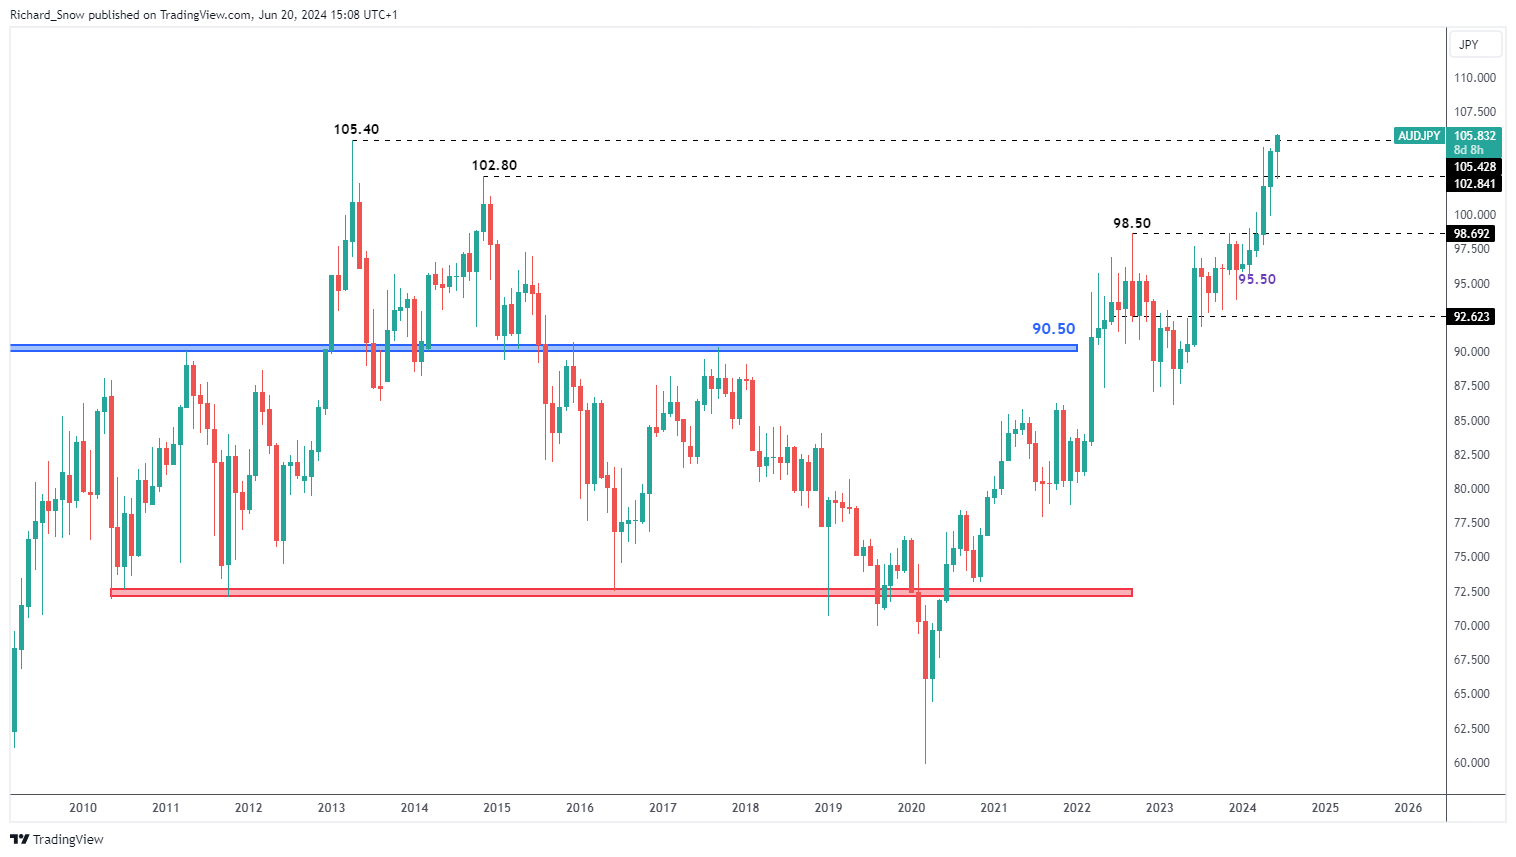
Source: TradingView, prepared by Richard Snow
Japanese Bonds Provide no Support for the Yen
Japanese bond yields have declined after trading comfortably above the 1% marker although, recently yields have perked up again. As long as the interest rate differential between the US and Japan remains as wide as it is (>5%), the yen is always going to be swimming upstream.
10Y Japanese Government Bond Yield
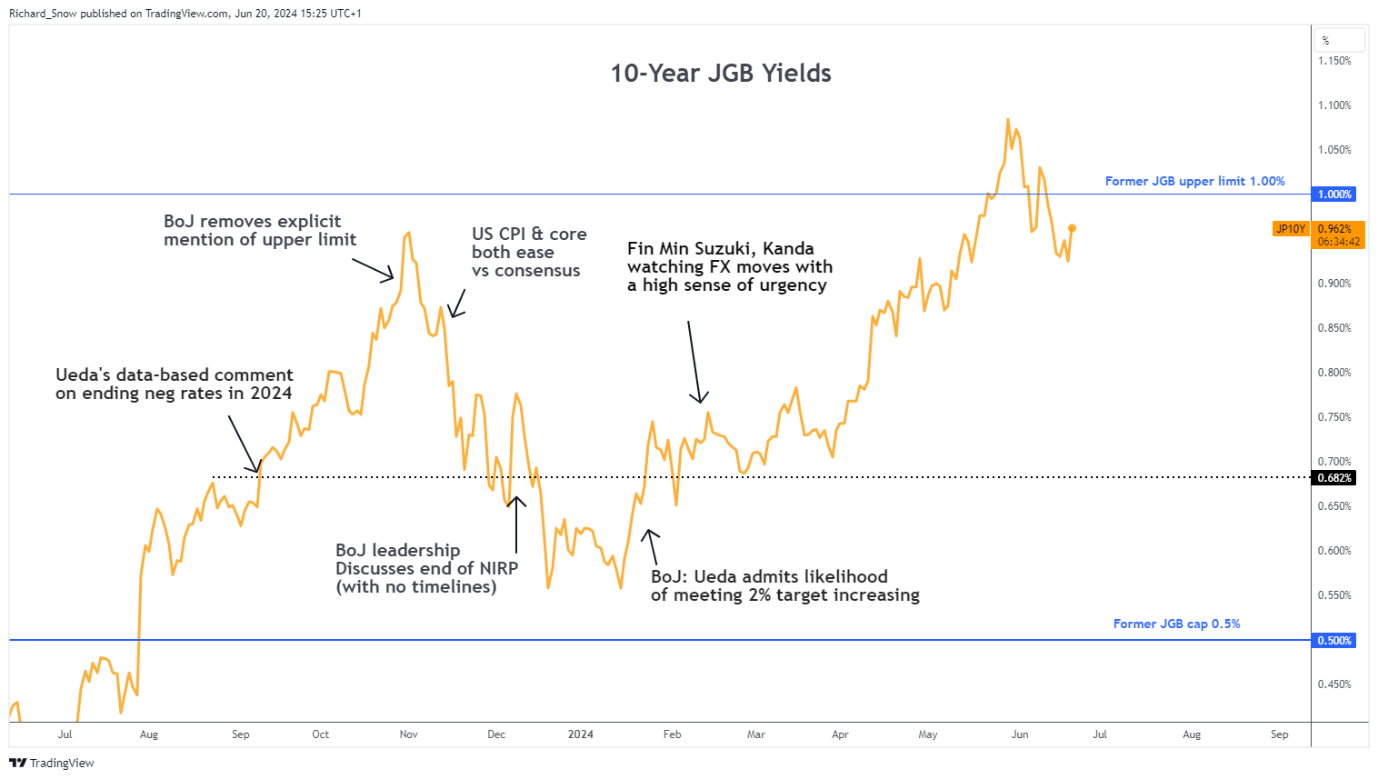
Source: TradingView, prepared by Richard Snow
USD/JPY Continues to Climb Higher Quietly
USD/JPY now appears set on the 160 marker, appreciating since the pair turned at 151.90. The RSI is nearing overbought territory on the weekly chart but Japanese officials will likely be observing the period of relatively lower volatility as a reason to stay their hand for now.
The weak yen has spurred on a wave of tourists as travelers top 3 million for a third month. The weaker yen however, has not escaped the attention of the country’s top currency official, Masato Kanda. According to Jiji, the official stated there is no limit to the resources available for foreign exchange interventions.
USD/JPY Weekly Chart
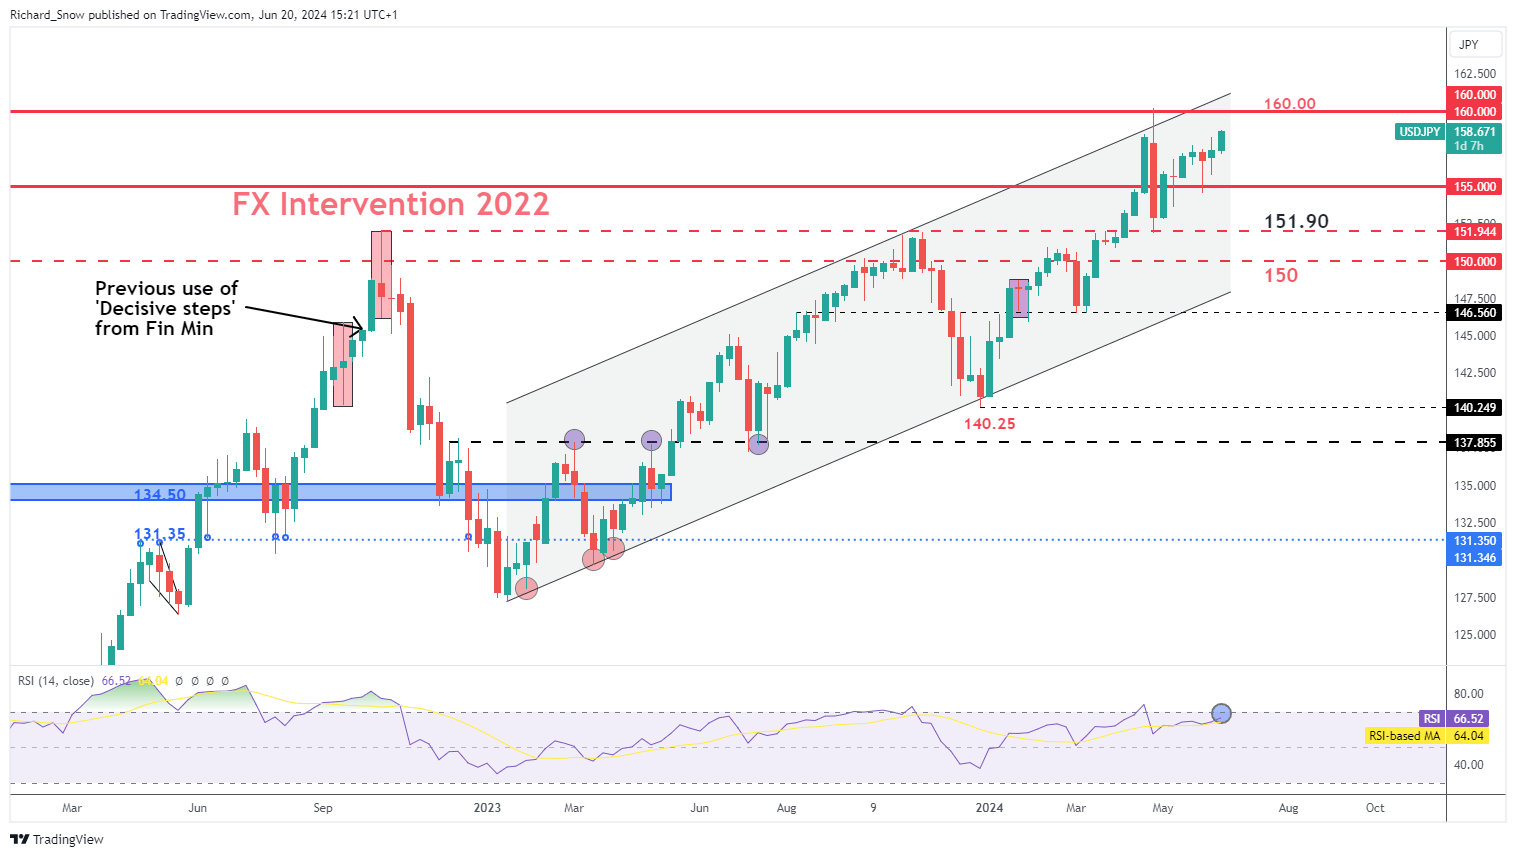
Source: TradingView, prepared by Richard Snow
| Change in | Longs | Shorts | OI |
| Daily | 9% | -2% | 0% |
| Weekly | 18% | 2% | 5% |
The next piece of top tier economic data appears via Japanese inflation in the early hours of Friday. The Bank of Japan needs further convincing that CPI and wages are continuing to exhibit a virtuous relationship or at least to the degree that would necessitate another rate hike.

Customize and filter live economic data via our DailyFX economic calendar
--- Written by Richard Snow for DailyFX.com
Contact and follow Richard on Twitter: @RichardSnowFX